"Fake #climatescam"
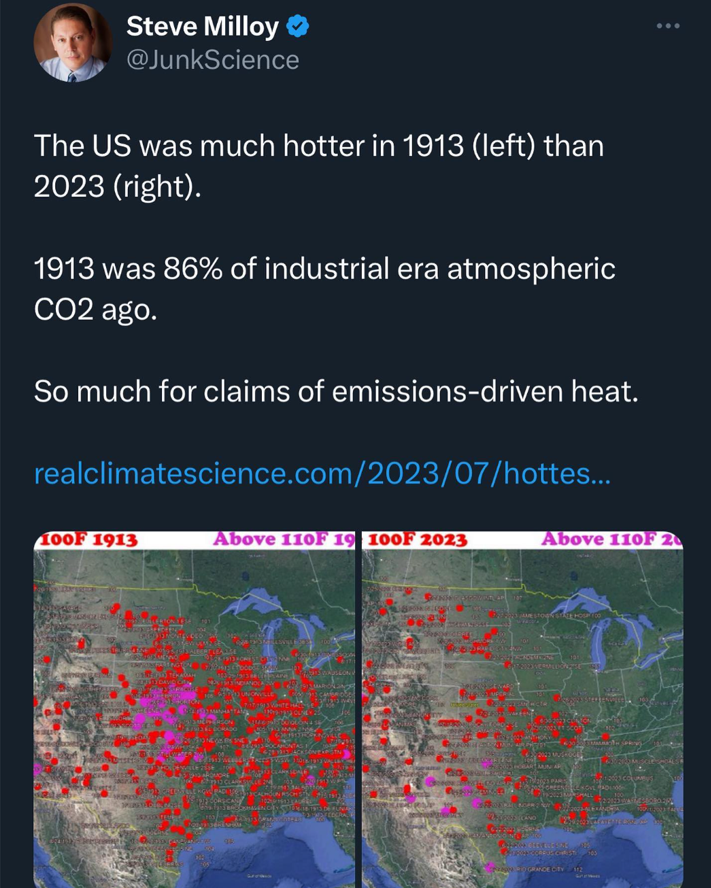
In the text of X’s post, it states, “The US was much hotter in 1913 – left – than 2023 – right.” Furthermore, X adds, “1913 was 86% of industrial era atmospheric CO2 ago (sic). So much for claims of emissions-driven heat.”
The caption on Instagram says, “All they do is lie with their fake #climatescam to extend power and control.”
Source: JunkScience/ X
Abundant Evidence
The Instagram post received close to 300 likes within a span of two weeks, while X’s post amassed over 1,000 reposts in just one week.
Climate experts have criticized the method employed in the post to determine the hotter year, which relied on the count of high-temperature days, deeming it scientifically invalid. It is projected that the average temperature across the contiguous United States in 2023 will exceed that of 1913, aligning with a sustained decades-long warming trend. Scientists have abundant evidence supporting the assertion that contemporary climate change is predominantly fueled by greenhouse gases emitted through human activities.
Source: Lukas Schulze/Getty Images
The Data Isn't Truthful
The post claims to display maps that allegedly chart occurrences of temperatures exceeding 100 degrees in the United States for the years 1913 and 2023. However, neither the post nor the linked article provides any information regarding the source of the data used to create these maps.

Source: David McNew/Getty Images
Not A Valid Method
Nevertheless, climate experts emphasize that counting instances of extreme high temperatures is not a valid method for determining whether one year was hotter than another.

Source: David McNew/Getty Images
Climate Trends And Extensive Datasets
Climate Reanalyzer, an online tool enabling users to access global weather and climate data, emphasizes that trends in the global climate should only be inferred from extensive, long-term datasets. The website, crafted and maintained by climatologist Sean Birkel, underscores that long-term warming trends are unequivocally discernible when examining data spanning several decades to over a century.

Source: Torsten Blackwood - Pool/Getty Images
"Complete Untruth"
Even though the hottest recorded air temperature on Earth was documented in Death Valley, California, on July 10, 1913, Howard Diamond, a senior climate scientist at the National Oceanic and Atmospheric Administration’s Air Resources Laboratory, firmly refutes the assertion that 1913 was a hotter year than 2023, characterizing it as a “complete untruth.”
Diamond affirmed the posts “have no basis in science and are not reflective of the state of today’s surface temperatures either in the U.S. or globally.”

Source: David McNew/Getty Images
NOAA Data
According to NOAA data, the contiguous United States experienced an average temperature of 51.5 degrees in the year 1913. Howard Diamond pointed out that this year was relatively cooler compared to later decades in the 20th century. The NOAA data ranks it as the 27th-coolest year of the 1900s.
Source: NOAA
The Average National Temperature Has Risen
Although data for 2023 is not yet available, NOAA records indicate that the average annual temperature for the contiguous U.S. stood at 53.4 degrees in 2022. It’s worth noting that the national average temperature has consistently exceeded the mean for the period 1901-2000 since 1997.

Source: Mario Tama/Getty Images
On A Global Scale
Shayla Powell, a spokesperson for the Environmental Protection Agency, concurred, highlighting that the rise in temperatures from 1913 to 2023 is even more conspicuous on a global scale.

Source: Heritage Space/Heritage Images/Getty Images
Increase In Average Surface Temperatures
Global average surface temperatures have shown a steady increase, rising by approximately 0.1 degrees per decade since 1880, totaling an increase of about 2 degrees overall. Data from various climate agencies corroborate this finding. Notably, the rate of warming has accelerated since 1981, nearly doubling in speed. Global temperatures have continued to rise at a pace exceeding 0.3 degrees per decade since the 1980s.
In contrast, temperatures in the contiguous United States have warmed at a faster rate than the global average, starting in the late 1970s, as indicated by EPA data.

Source: Spencer Platt/Getty Images
Human Activities Are The Primary Driving Force
The X post utilized temperature spike data to argue that human emissions are not the driving force behind global warming. However, scientists have accumulated substantial evidence demonstrating that contemporary climate change is primarily driven by human activities, such as the combustion of fossil fuels.
Source: David Goddard/Getty Images
The Escalated Release Of Carbon Dioxide
Human activities are releasing carbon dioxide at a rate that exceeds the capacity of natural processes to remove it, leading to a buildup of carbon dioxide in the atmosphere. Greenhouse gases, including carbon dioxide, absorb and emit heat, resulting in the warming of the Earth’s atmosphere and surface temperatures.
Source: Ryan Pyle/Corbis via Getty Images
Carbon Dioxide Levels Keep Increasing
In a significant milestone, atmospheric carbon dioxide concentrations exceeded 400 parts per million in 2013, marking the first time since scientists began monitoring levels in the mid-twentieth century. As of 2022, NOAA reported a peak of 417 parts per million, underlining the continued rise in carbon dioxide levels.

Source: Sean Gallup/Getty Images